In part one of our Windows Logging Guide Overview, we covered the basics of Windows logging, including Event Viewer basics, types of Windows logs, and event severities. Here in part two, we’ll take a deeper dive into Windows log management and explore more advanced techniques for working with Windows logs.
In addition to creating custom views and using PowerShell to filter Windows event logs, we’ll look at important Windows security events, how to use Task Scheduler to trigger automation with Windows events, and how you can centralize your Windows logs.
Learn More
Explore the complete Windows Logging Guide series:
- Part 1: The Basics
- Part 2: Advanced Concepts
- Part 3: Logging With IIS and SQL Servers
- Part 4: Centralizing Logs
Creating Custom Views in Windows Event Viewer
Creating custom views in Windows Event Viewer allows administrators to group events they care about in a single view. Custom views are a great way to help with reporting or long-term troubleshooting.
How to create a custom view in Windows Event Viewer
To create a custom view in Windows Event Viewer, follow the steps below. Note that we’ll use Windows 10 as a baseline, but the process is similar for most modern Windows operating systems with a GUI.
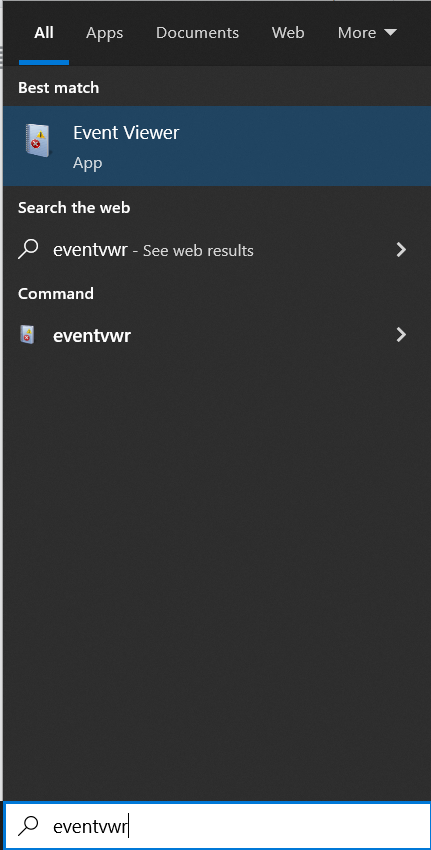
1. Launch Event Viewer.
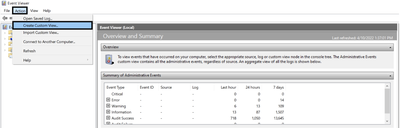
2. Click Action → Create Custom View.
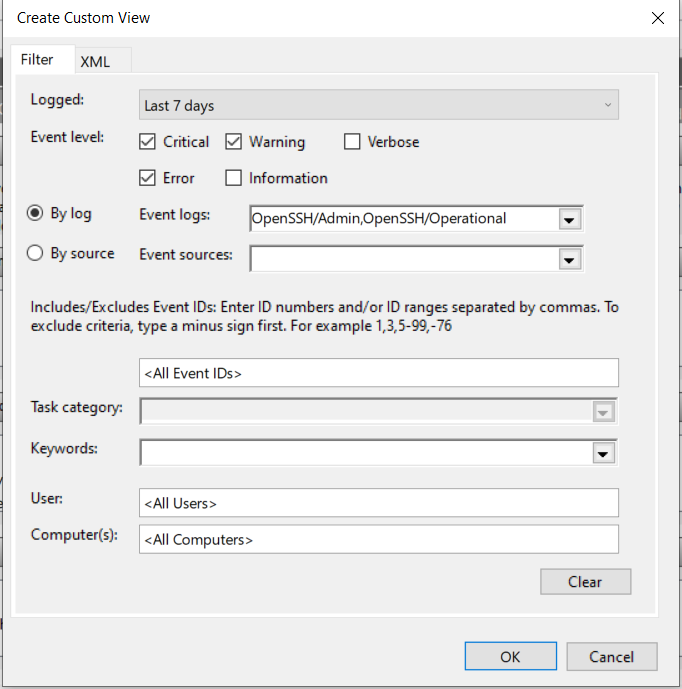
3. In the Create Custom View pop-up window, use these fields to create your custom view:
Below is a description of each field. Note that the “By log” and “By source” options are mutually exclusive.
| Event Viewer Custom View Field | Description |
|---|---|
| Logged | A time range for the custom view filter. |
| Event level | The severity of events to be included in the custom view. |
| By log | A selection of logs to which the custom view applies. You can select from various Windows logs (Application, Security, etc), Applications and Services Logs, or Saved Logs. |
| By source | A selection of Windows Event Sources (for example: drivers, applications, and services) the custom view will include. |
| Includes/Excludes Event IDs | A list of specific Event IDs to include or exclude from the custom view. You can include Event IDs as comma-separated individual values (e.g. 1,2,5 for Event IDs 1, 2, and 5) and ranges (e.g., 1-9,11-15 for Event IDs 1 through 9 and 11 through 15). You can add a minus sign to exclude an Event ID (e.g., -1111 excludes Event ID 1111). You can combine these different approaches for more granular filters (e.g. 2,5-20,-11 would include Event ID 2 and Event IDs 5 through 20, except for Event ID 11). |
| Task category | A filter of specific categories of Event Sources. For example, Microsoft Windows security auditing includes task categories such as Security State Change, Logon, Logoff, Account Lockout, and Special Logon. |
| Keywords | A selection of Keywords to the events in the custom view must match. For example, AuditFailure and AuditSuccess are common Standard Event Keywords related to security events. |
| User | Selects the users the filter applies to. |
| Computer | Selects the computers the filter applies to. |
Below is an example of a custom view configured to show all Critical, Error, and Warning severity events logged by OpenSSH/Admin and OpenSSH/Operational within the Last 7 days.
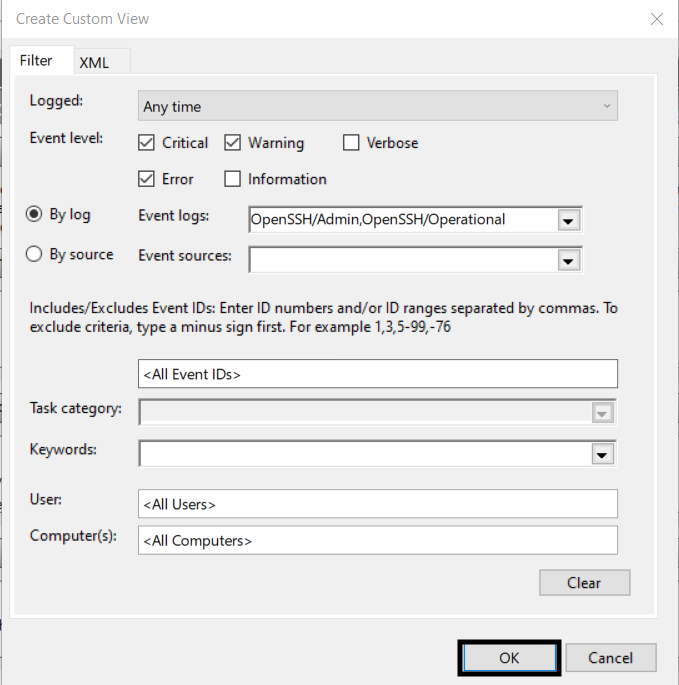
4. Once your filters are applied, click OK.
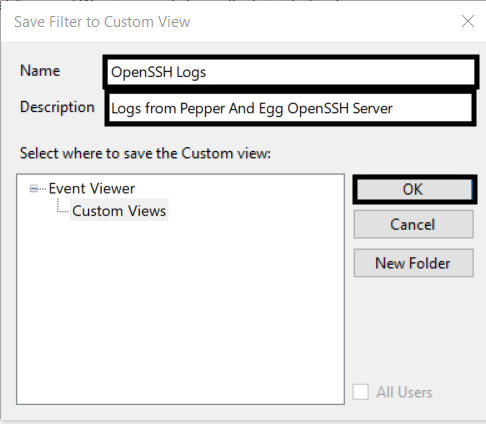
5. In the Save Filter to Custom View popup, give the view a Name and Description (optional), create a folder for the custom view (optional), and then click OK.
XML-based custom views in Windows Event Viewer
Event Viewer also supports importing and creating custom views in XML format using Xpath 1.0 syntax. XML and Xpath can be a great way to add granularity to your Event Viewer queries for advanced logging.
Let’s take a look at the the XML format of our previous custom view:
<QueryList>
<Query Id="0" Path="OpenSSH/Admin">
<Select Path="OpenSSH/Admin">*[System[(Level=1 or Level=2 or Level=3) and TimeCreated[timediff(@SystemTime) <= 604800000]]]</Select>
<Select Path="OpenSSH/Operational">*[System[(Level=1 or Level=2 or Level=3) and TimeCreated[timediff(@SystemTime) <= 604800000]]]</Select>
</Query>
</QueryList>
Note how the Select Path parameters are nested as a Query inside a Query List. You can access the XML version of an Event Viewer view on the XML tab of the Create Custom View popup. To check out existing custom views, open the Custom View Properties popup.
In addition to creating custom views, XML and Xpath are useful for programmatically consuming, querying, and subscribing to Windows events. The Windows documentation takes a deeper dive into those topics.
Using PowerShell to Get Local and Remote Event Logs
PowerShell is the Swiss Army Knife of Windows administration and can be used for parsing Windows logs too. One of the most important PowerShell cmdlets for viewing logs is Get-WinEvent, so let’s take a look at how it works.
Viewing Windows events in PowerShell
The simplest way to view logs via PowerShell is with this command:
Get-WinEvent -LogName '<log name>'
For this command, <log name> is the name of a specific log file. For example, this command will dump all the System logs.
Get-WinEvent -LogName 'System'
However, logs on production systems will usually have thousands of records, which makes dumping all the logs to the terminal impractical.
Fortunately, there are several ways we can use PowerShell to filter log output. For example, by appending a -MaxEvents X parameter (where X is a positive integer), we can limit the display to the last X entries in a given log file. For example, for the last ten events in the Windows Security log, we can use this command:
Get-WinEvent -LogName 'Security' -MaxEvents 10
For more powerful filtering, we can use the -FilterHashTable option to leverage PowerShell hashtables.
Hashtables store data in key/value pairs and help enable more efficient queries and filters. With the Get-WinEvent cmdlet, we can pass “keys” like LogName (to specify a log file), ID (to specify an Event ID), or Level (to specify a severity) to streamline our log filtering. The Level key corresponds to Windows Standard Event Level Enumerations which means 0-5 correspond to the following levels:
| Name | Value |
|---|---|
| LogAlways | 0 |
| Critical | 1 |
| Error | 2 |
| Warning | 3 |
| Informational | 4 |
| Verbose | 5 |
Generally, -FilterHashTable arguments are specified as:
@{Key1='Value1'; 'Key2'='Value2';...;KeyN='ValueN'}
With all that information in mind, here’s how we can filter for the last five Error events in the Application log:
Get-WinEvent -FilterHashTable @{LogName='Application';Level='2'} -MaxEvents 5
Viewing Windows events from a remote computer in PowerShell
Thus far, our PowerShell commands have connected to localhost , which is the default option for the -ComputerName parameter. To connect to a remote Windows machine and retrieve logs, we need to specify a different -ComputerName as an IP address, NetBIOS name, or fully qualified domain name (FQDN) and provide a -Credential parameter.
For example, we can modify our previous command to connect to a Windows server with IP address 198.51.100.1 with the username example using this command:
Get-WinEvent -FilterHashTable @{LogName='Application';Level='2'} -MaxEvents 5 -ComputerName 198.51.100.1 -Credential example
Getting events from an event trace log with PowerShell
Event trace log (.etl) files are binary files that provide detailed Windows performance information for troubleshooting, debugging, baselining, and monitoring. The graphical Windows Performance Analyzer (WPA) tool is a common method for opening and viewing .etl files, but it isn’t the only option. Administrators can also use PowerShell to read events from a .etl file.
The basic syntax PowerShell uses to read a .etl file is as follows:
Get-WinEvent -path <path to .etl file> -Oldest
Note that because .etl files are read in reverse order, the -Oldest parameter is required.
Important Windows Events to Monitor and Why
Security is one of the most important aspects of Windows logging. Several well-known Event IDs can have security implications, and monitoring them can help you detect threats quickly. Windows maintains a detailed list of Events to Monitor for server operating systems, and here are some of the most notable Event IDs with potential security implications:
| Event ID | Description | Why it matters |
|---|---|---|
| 4624 | Successful logon | In most contexts, a successful logon is indicative of normal behavior. However, in some contexts (e.g., outside of business hours) a successful logon could be suspicious. Additionally, recording logons enables more effective root-cause analysis after a security incident occurs. |
| 4625 | Unsuccessful logon | Multiple unsuccessful logon attempts could be indicative of an attempt to brute force a password or otherwise compromise an account. |
| 1102 | Audit log cleared | Clearing an audit log could be indicative of an attacker attempting to cover their tracks. |
| 4663 | Attempt made to access an object | For many objects, this event has minimal security value. However, Microsoft security recommendations include auditing access to critical file system objects which is where Event ID 4663 is helpful. |
| 4740 | User account locked | A user account may be locked due to suspicious or malicious behavior (e.g., attempting to brute force a password). |
| 4618 | A monitored security event pattern has occurred | This event is triggered manually or intentionally by a program/script. Therefore, the security implications can vary significantly between environments. |
How to Use Task Scheduler to Automate Actions Based on Windows Events
In addition to enabling the periodic execution of tasks on Windows systems, Task Scheduler can trigger programs and scripts when a specific event occurs. This enables a broad range of event-driven Windows automation.
Here is how you can use the Task Scheduler graphical interface to automatically execute a program or script when a specific Windows event occurs.
1. Launch Task Scheduler by executing the taskschd.msc command from a Run prompt.

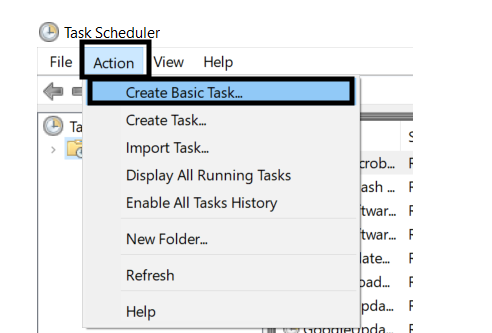
2. Click Action → Create Basic Task.
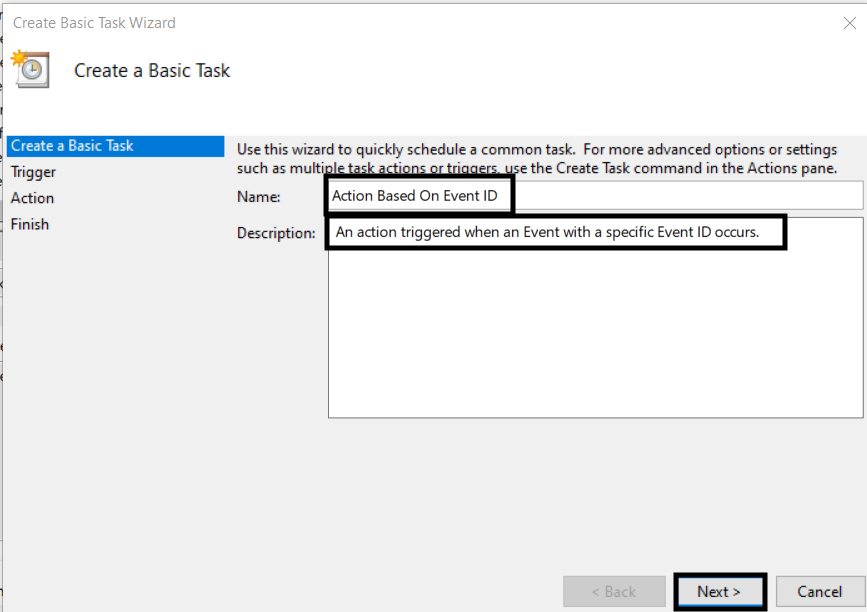
3. In the popup wizard, give the job a Name and Description, then click Next.
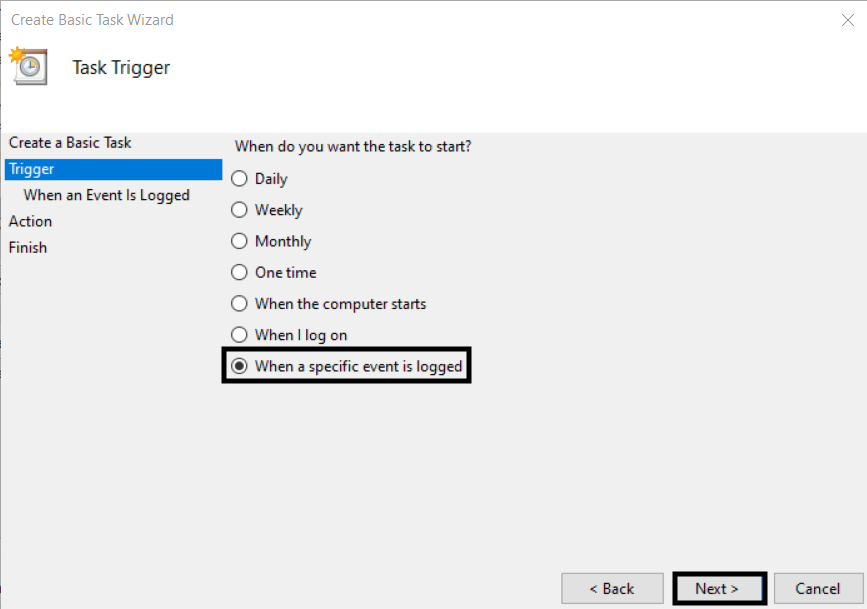
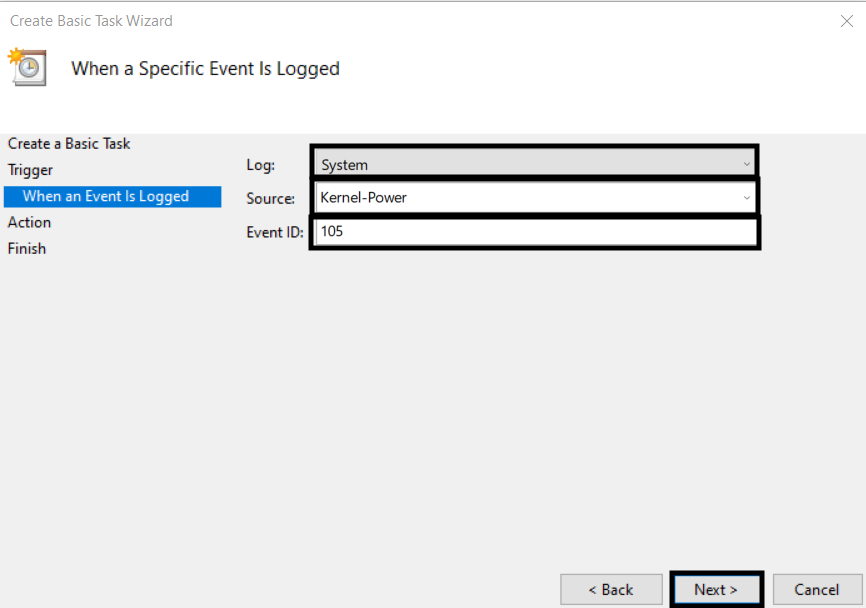
4. Select the When a specific event is logged radio button, then click Next.
5. Input a Log, Source, and Event ID, then click Next. We’ll use Kernel-Power Event ID 105 (“Power source change”) from the System log in this example.
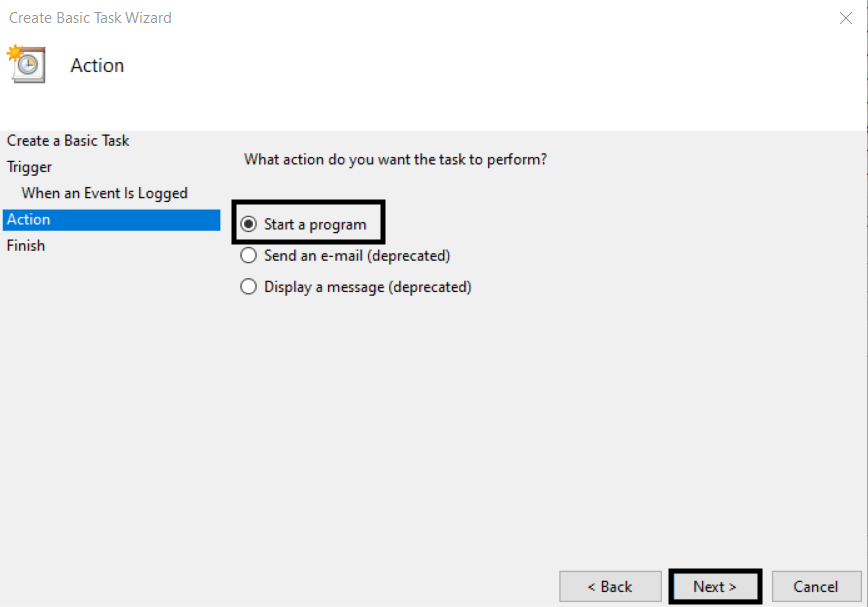
6. Leave the Start a program radio button selected and click Next.
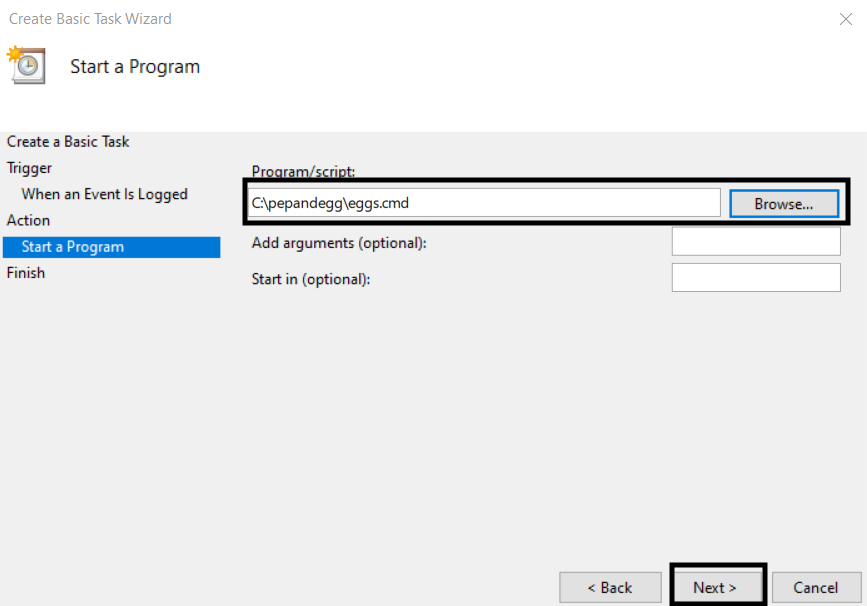
7. Browse to the program or script you want to execute, optionally specify parameters and a start directory, then click Next.
8. Confirm the information in the wizard is correct, then click Finish.
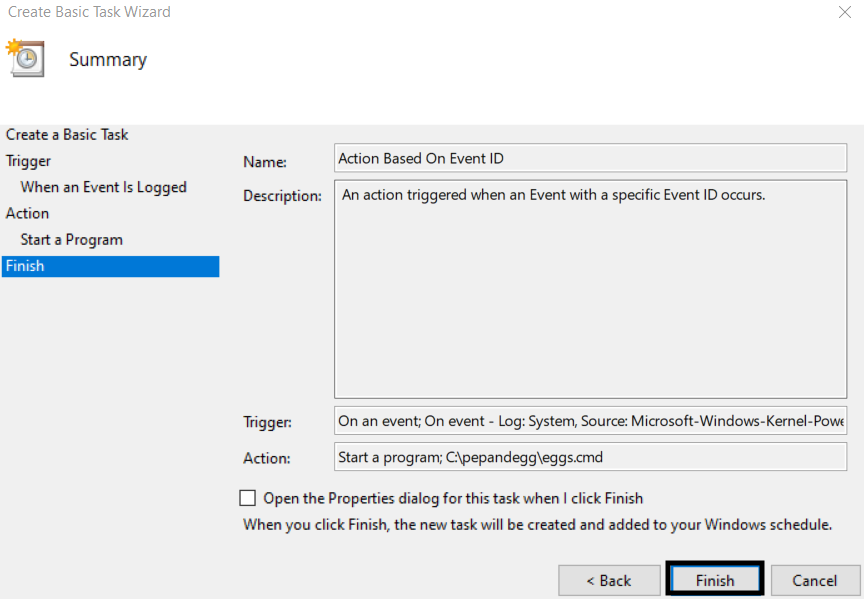
That’s it! Now, Task Scheduler will attempt to execute the program or script when the specific event occurs.
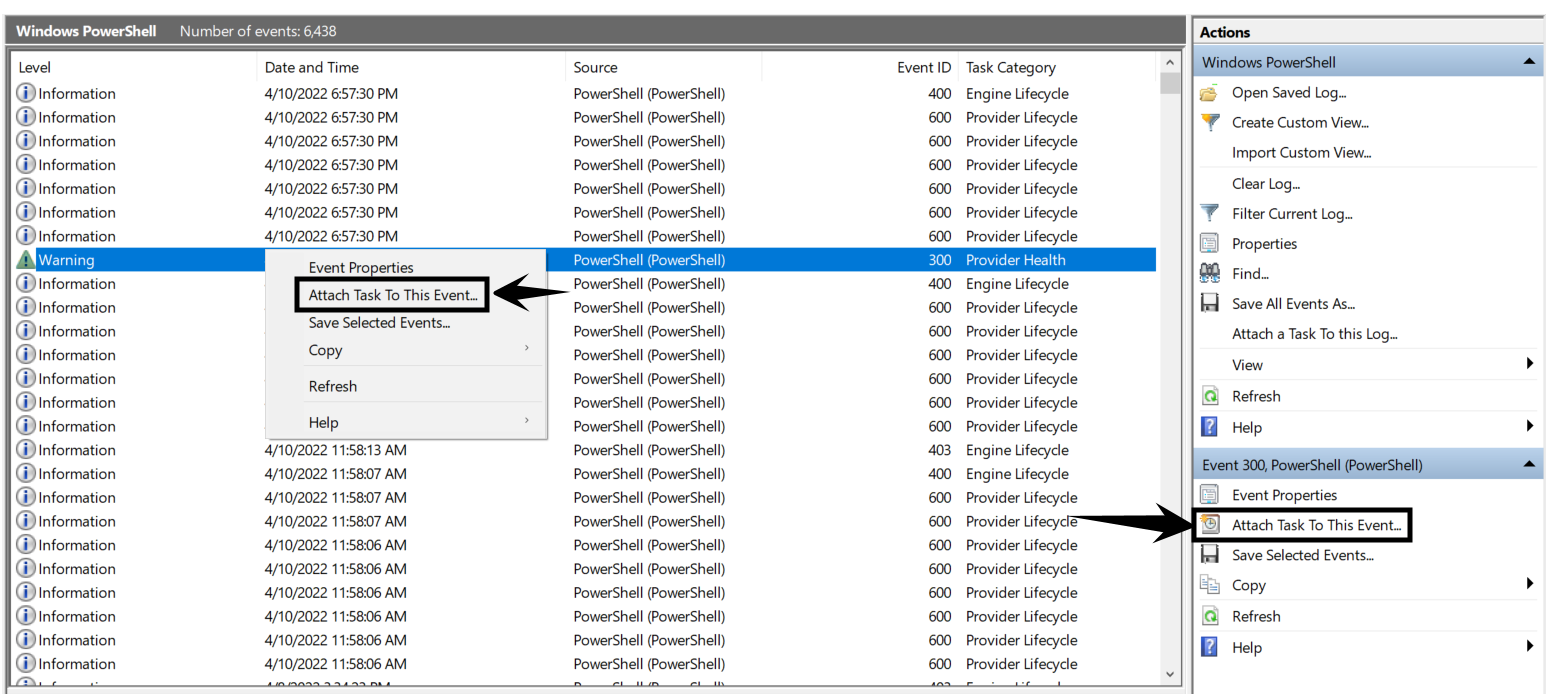
You can also use the New-ScheduledTask PowerShell cmdlet or select Attach Task To This Event when you have an event highlighted in Event Viewer to create Task Scheduler jobs.
How to Centralize Windows Logs
When you have more than a few servers to manage, individually monitoring logs on each Windows machine becomes tedious and inefficient. Centralizing logs makes Windows administration at scale practical without sacrificing visibility.
Windows Event Collector provides a native Windows mechanism for collecting and forwarding events. Event Collector manages event subscriptions for systems that support the Web Services Management (WS-Management) protocol and allows administrators to centralize their Windows logs.
Additionally, for heterogeneous environments with a mix of both Windows and non-Windows systems, third-party observability and log-management tooling can centralize Windows logs. For example, the Falcon LogScale platform has two Windows-compatible Log Shippers:
- Winlogbeat– Can forward Windows event logs to the Falcon LogScale platform.
- Metricbeat– Is a lightweight log shipper that collects a variety of resource statistics such as CPU, RAM, and storage.
What’s Next?
Whether you need to troubleshoot issues with a new set of drivers or leverage PowerShell to capture Windows logs from multiple machines, you should now have a solid understanding of Windows logging. From here, you can begin to test and implement some of the techniques we’ve reviewed in our Windows logging guide to improve your network visibility.
Log Everything, Answer Anything – For Free
Falcon LogScale Community Edition (previously Humio) offers a free modern log management platform for the cloud. Leverage streaming data ingestion to achieve instant visibility across distributed systems and prevent and resolve incidents.
Falcon LogScale Community Edition, available instantly at no cost, includes the following:
- Ingest up to 16GB per day
- 7-day retention
- No credit card required
- Ongoing access with no trial period
- Index-free logging, real-time alerts and live dashboards
- Access our marketplace and packages, including guides to build new packages
- Learn and collaborate with an active community